

Volume 47 No. 5 ● May 1, 2022 ● Member Sneak Peek
Schools need leading indicators of enrollment demand for myriad reasons, not the least of which is to plan and prepare for the admission cycle. ISM has helped thousands of schools conduct surveys to understand what parents, students, and teachers think about their schools. While advancing your school’s mission and delivering on the Portrait of the Graduate are your primary goals, constituent satisfaction is also key. This is because word-of-mouth referrals remain the dominant way prospective parents are drawn to a private school. Your parents’ and students’ satisfaction also has a significant influence on whether families decide to enroll year-to-year. However, conducting comprehensive, full-scale surveys for all constituent groups is something schools may not be able to do annually.
One solution for monitoring consumer satisfaction across industries is the Net Promoter Score Survey (NPS®).1 For schools, the NPS is based on the responses to a single question that asks the likelihood, on a scale of 0–10, that the person will “recommend the school to a friend or family member.” Because a score can be determined from a single item, NPS surveys can be conducted quickly, more frequently, and with less likelihood of survey fatigue.
The NPS is derived easily. Survey participants responding with 0–6 are considered “detractors,” responses of 7–8 are classified as “passives,” and ratings of 9–10 are termed “promoters.” The NPS is determined by subtracting the percentage of detractors from the percentage of promoters, yielding a potential score ranging from -100 (all respondents are detractors) to 100 (all are promoters). The higher an organization’s score, the stronger their customer loyalty and healthier their word-of-mouth grapevine.
In a previous article, we advised schools to use the generally prescribed benchmarks for the Net Promoter Score (across all industries), which are 0–50 (good), 50–70 (excellent), and 70–100 (world class). However, it is clear from other industries that each has its own benchmark and ranges differ significantly. Drugstores, for example, have a notoriously low NPS average, while department store averages are much higher.
For more than three years, ISM has tracked scores for private schools within three constituent groups—parents, students, and teachers—to establish range descriptors for each. The distributions of scores were analyzed and then compared to other known measures of school performance to validate the labels.
Students
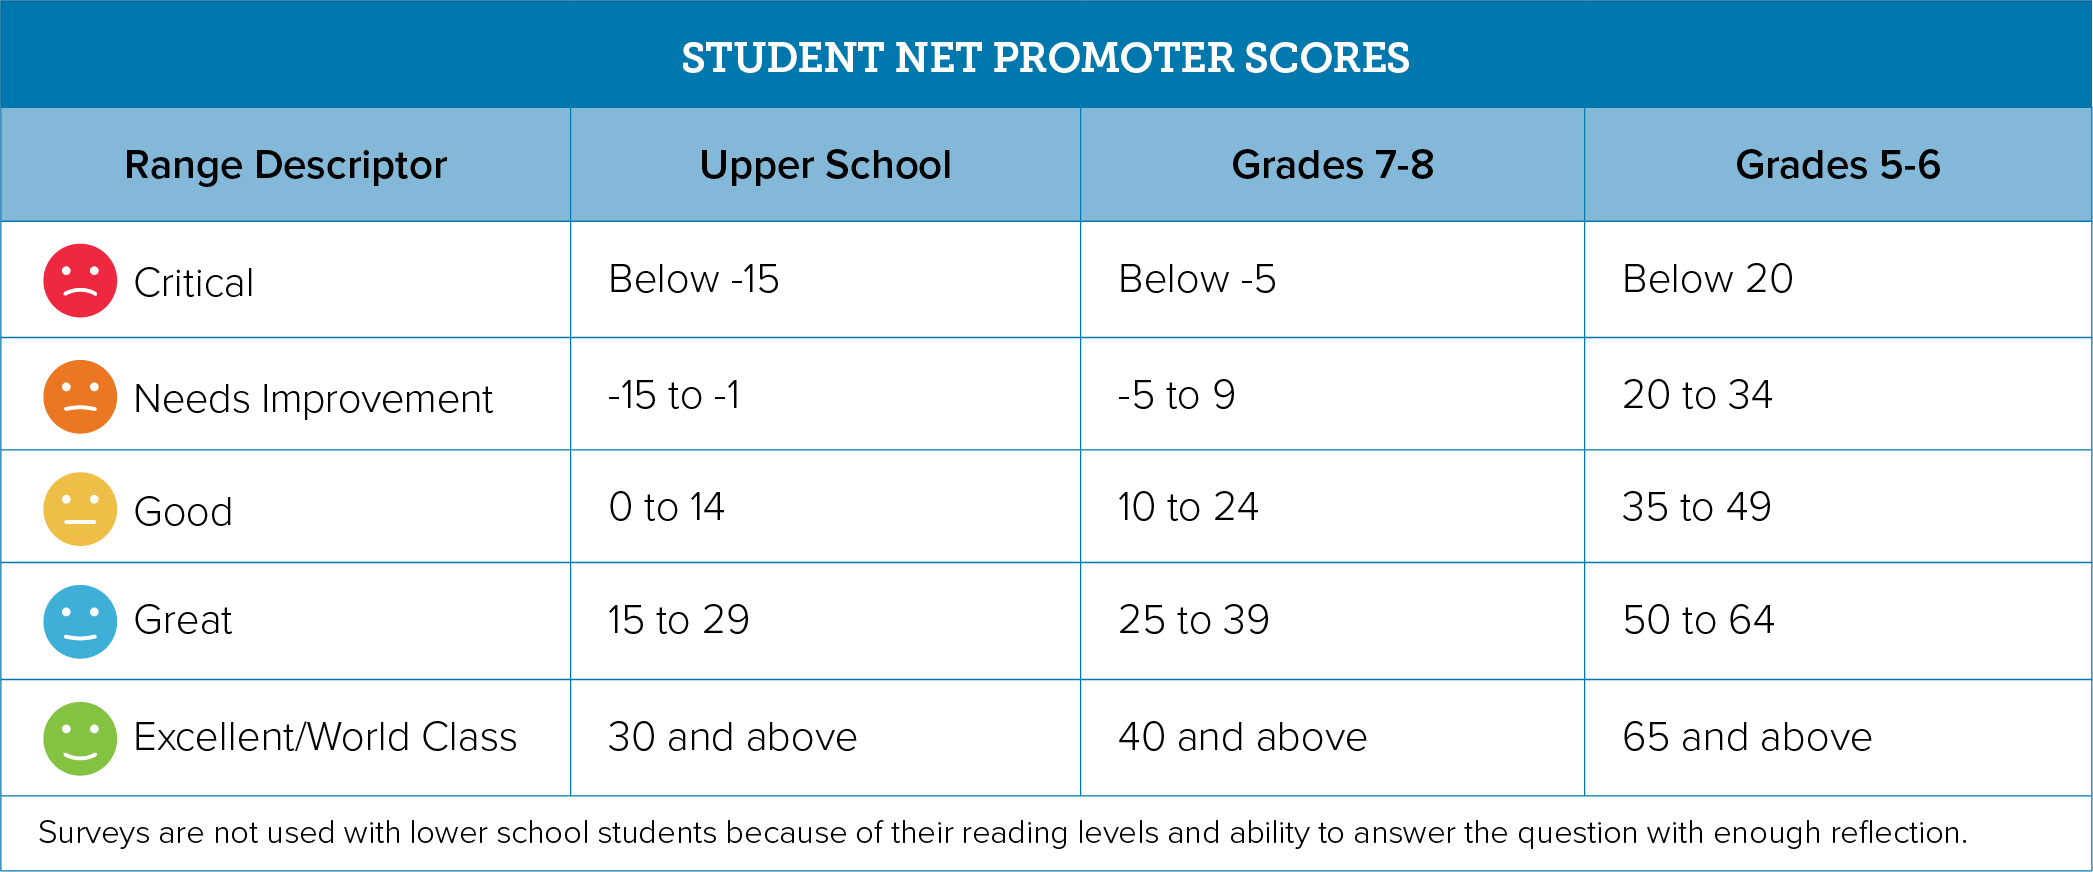
More than 26,000 students in grades 5–12 responded to ISM surveys over the course of the study. As with other ISM student surveys, such as the Student Experience Profile, a distinct and consistent pattern of responses emerged in which older students are less likely to be “promoters” and more likely to be “detractors.” This is in line with a long-standing finding that with each successive year students are in school, the more they report disliking the experience. The distribution of Net Promoter Scores significantly shifts downward from upper grades.
ISM’s NPS student ranges reflect the variance based on grade level. For example, a score of 15 would be in the “Critical” range for grades 5–6, in the “Good” range for grades 7–8, and considered “Great” for high school respondents. An aggregate, student NPS for grades 5–12 is never advised. Instead, compare scores within the groups indicated in Table 1.
Table 1. Student NPS Ranges by Grade Levels
Parent
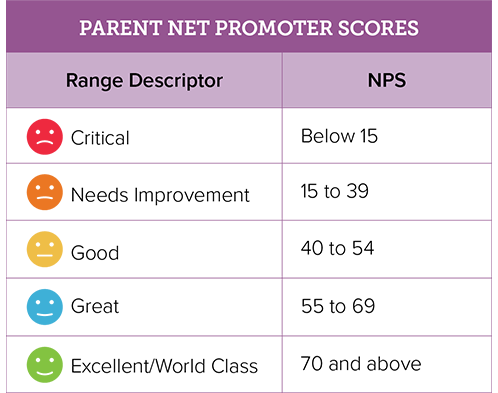
ISM analyzed 28,477 parent responses across 95 schools. Parent scores correlated significantly with the parents’ ratings of the value they receive for tuition dollars paid (r=.66), the parent community (r=.27), and their re-enrollment intentions (r=.29).2 The ranges (see Table 2) help identify the status of re-enrollment and value perceptions. For example, at the highest-scoring NPS school, 89% of families reported they were planning to stay until graduation, while only two of 259 families noted they were not likely to stay (the remaining 11% were undecided). However, at the lowest-scoring school, 63% of families reported they were likely to stay.
Table 2. Parent NPS Ranges by Grade Levels
Faculty
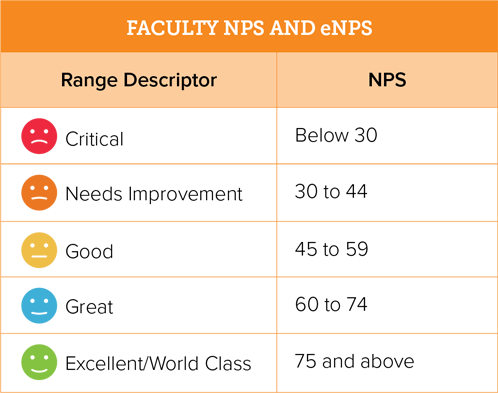
For faculty, two NPS questions are asked. The first, “On a scale of 0–10, how likely are you to recommend the school to a friend or family member for his or her child(ren) as a school?” The second question asks, “On a scale of 0-10, how likely are you to recommend the school as a place of employment?” The former is termed the “Faculty NPS,” while the latter is termed “eNPS” with the “e” standing for employment. Despite measuring different concepts, both questions yielded the same ranges.
Faculty NPS and eNPS scores were found to be significantly, and positively correlated with faculty culture and their experience with the faculty evaluation process. Both were negatively correlated with stress. Not surprisingly, the scores were also found to correlate with each other (r=.71).
Table 3. Faculty NPS and eNPS Ranges
Scores in each group correlated with other measures of school performance, lending validity to the data the NPS provides. However, each group was found to have unique response patterns that require different ranges that define the descriptors, from “Critical” to “Excellent/World Class.”
The NPS paradigm allows schools to measure the “temperature” of various constituent groups quickly and easily. We recommend schools make the NPS questions a regular part of their survey strategy.
1. The NPS® is an evaluative management instrument created by business strategist Frederick F. Reichheld to determine the loyalty and satisfaction of a company’s customers.
2. The items referenced are from ISM’s Parent Satisfaction survey, each assessed on a 5-point scale. They include: “Please rate the overall value of the education your child(ren) is(are) receiving at [School] based on the tuition and fees paid.” (Unacceptable Value to Excellent Value). “Please indicate your child’s current grade and whether you intend to have them continue at [School] through the [terminal grade for the school]” (Will Not Stay to Will Stay/Graduating). “Please indicate your opinion of the Parent Community” (On a scale from 1-5 from Very Poor to Excellent).

Get access to research-driven content like this and much more for your entire school.
For a limited time: Pay $500* for one year of ISM’s Silver membership—a 64% savings! Offer ends 1/13/2023.
*Offer only available to new members. Fees may apply.